
What Reports to Use Based on Your Goals
What reports to use based on your goals?
There are many ways to pull reports from MaintiMizer™. We have pre-built reports in different modules, but we also have our robust Query Builder, which can pull just about any data you’d need with a few clicks. It can, however, be overwhelming. It doesn’t have to be, though—pulling data based on only your goals is the key. Tim Gelletly, director of business development, states, “In my opinion, customers should be thinking about the data they require (and a good test of this is asking themselves a simple question: when I get this data, what will I do with it?) and then build the simplest query in MaintiMizer to meet that need.”
Let’s look at the specific reports you want to pull based on your goals:
Goal: Reduce Backlog
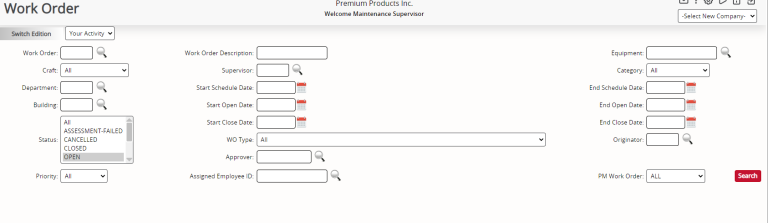
Search/update work order
This report seems to be popular. By using this data builder, you can search for open or closed work orders in a certain time frame. Use this data to see how your month went versus how your current month is going and if there are days that have more open work orders than others and why. You can also use this data to see how long work orders have been open. This one report can give you a ton of information with only a few clicks.
Backlog review list
See what work needs to be done, and schedule it in order of importance. To determine which work orders should be done first, read our last blog post—“4 Reasons You Need Asset Hierarchy and Criticality Analysis.”
Goal: Improve Inventory Management
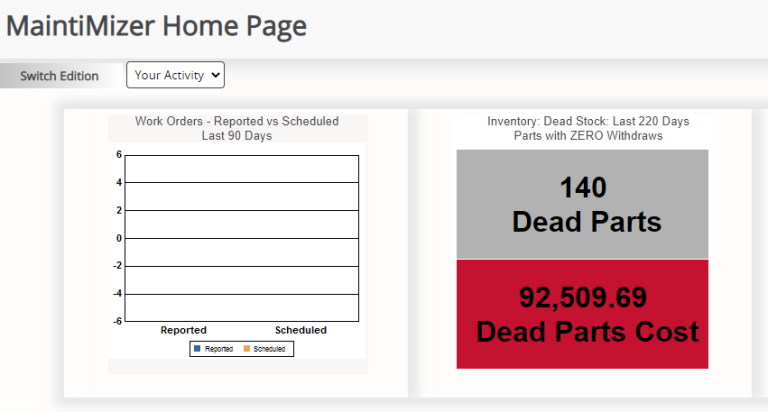
Dead Stock widget in 5.0
If your goals include a better inventory management system, we have a few reports you can look at. In 5.0 we have a widget for your home screen that’s called Dead Stock. In your settings (from the side menu, choose the general drop-down tab, choose settings, then scroll down to the home-page module), you can choose to show this widget on your home screen and how many days back you’d like to see (30, 60, 90, etc.). Now every time you log into MaintiMizer™, you’ll see how many parts haven’t been used in that number of days along with the total cost of those parts. Clicking on the widget brings you to a report that shows you which parts are included in that report, making it easy to know which parts you can scale down on or not have on hand at all if the lead time is short.
Non-active/active parts
Look at non-active parts for the past year to decide if you have too many or need to keep that specific part in stock at all. To determine whether to keep a part on hand or factors to consider when deciding the amount to keep on hand, check out our “Do You Barcode” blog post.
Goal: Reduce Failures
Failure analysis
To help reduce unexpected failures, this report shows how many failures an asset has had over a period of time. You’ll be able to track trends to see if there is room for improvement or to know when to expect the next failure (if failure is unavoidable).
Mean time between failures
Gelletly recommends this report: “A great report that doesn’t get used too much is the Mean Time Between Failure (MTBF) report. If properly used, this can help influence and optimize PM schedules for their business.”
Here are a few tips when pulling reports from MaintiMizer and using our Query Builder from Gelletly:
Keep it simple!
- “Generally, I find that customers need the most help critically thinking about the data they want to present, and this presents when looking for a report or building a query. The report that they should be using is often a simple query but then is laden down with several modules, screens, and fields, making the report less cooperative and useful. In my opinion, customers should be thinking about the data they require (and a good test of this is asking themselves a simple question: when I get this data, what will I do with it?) and then building the simplest query in MaintiMizer to meet that need.”
The best practices I suggest are the following:
- Think about the data you need to see and the order you want them in.
- Take the time to locate these data in MaintiMizer, and write down which module you can find that data in.
- Go to the QUERY TOOL, select the module, then select the fewest number of screens necessary. Finally, select the fewest fields to present as possible. Remember to use the variables in the grid. Run the query, and confirm it is presenting what you asked it to do.
If you have questions on how to pull these reports, email support@ashcomtech.com. Need an in-depth overview of these reports and how to use the data they collect? E-mail us at implementation@ashcomtech.com, and we can set up training classes for you and your team!